2026 · Product, engineering
Solarscandinavia — Solar Investment Tooling
Two connected tools for the Swedish solar market — an investment calculator (NPV, IRR, LCOE, elcertifikat) and a map-driven proposal studio that designs arrays on satellite imagery and prints the quote.
- TypeScript
- React 18
- Vite
- Google Maps Platform
- Google Solar API
- GeoTIFF
- Chart.js
- OpenAI API
Context
Two tools, one workflow. An installer needs to answer two questions for every lead: is it worth it? and what does the array actually look like on this roof? SolcellsKalkyl answers the first — a full Swedish investment case with NPV, IRR, LCOE, and payback. SolOffert answers the second — panel layout drawn on satellite imagery, sized against Google's Solar API, exported as a proposal.
They share a domain (Swedish PV economics, elcertifikat, tariff structure) and a reading order: design the array in SolOffert, run the numbers in SolcellsKalkyl, hand the customer the quote.
SolcellsKalkyl — the investment case
A single-file, browser-based financial model. One HTML file (~117 KB), no build step, no backend — open it and the full calculator is live. Vanilla JS, state lives in the DOM, calc() re-runs the model on every input change.
Five tabs, one document
- Indata — system spec, monthly production, itemised costs, financial parameters, tariff structure, electricity-price scenarios, elcertifikat.
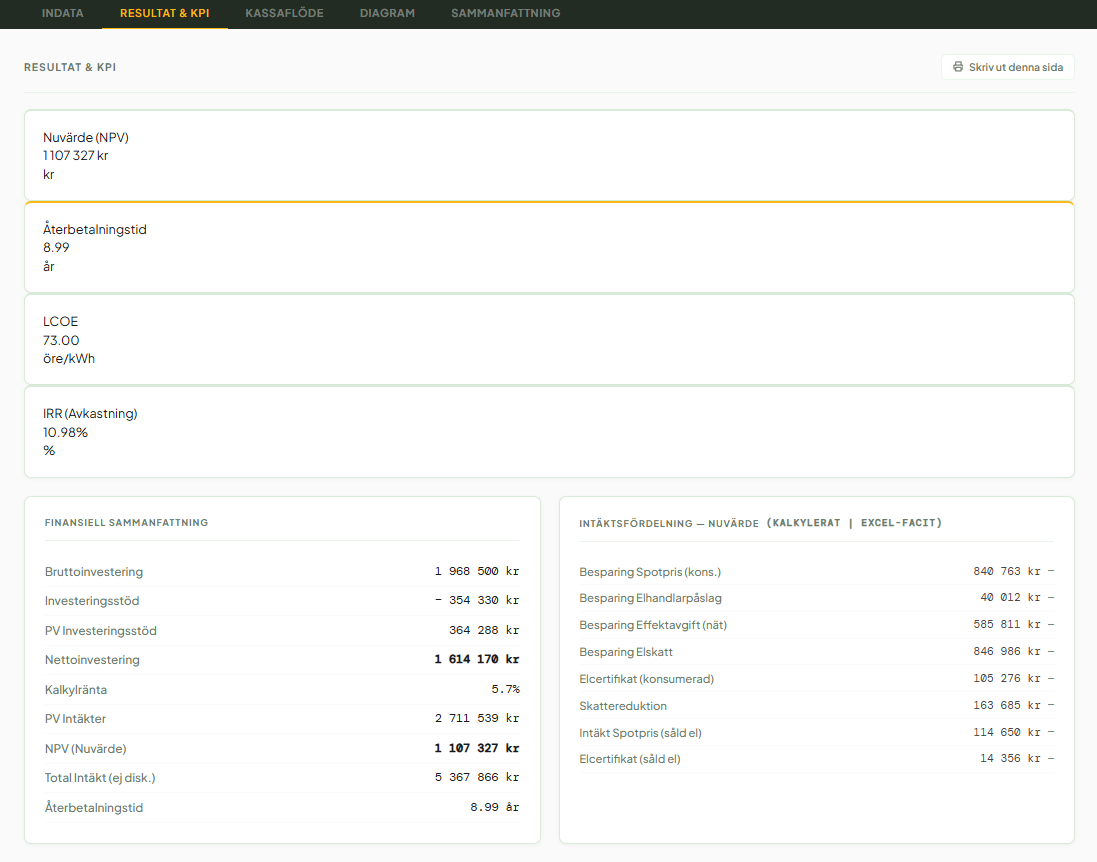
- Resultat & KPI — headline metrics, financial summary, PV-revenue split.
- Kassaflöde — 13-column year-by-year cash flow: production, tariff savings, certificate income, tax deductions, accumulated net.
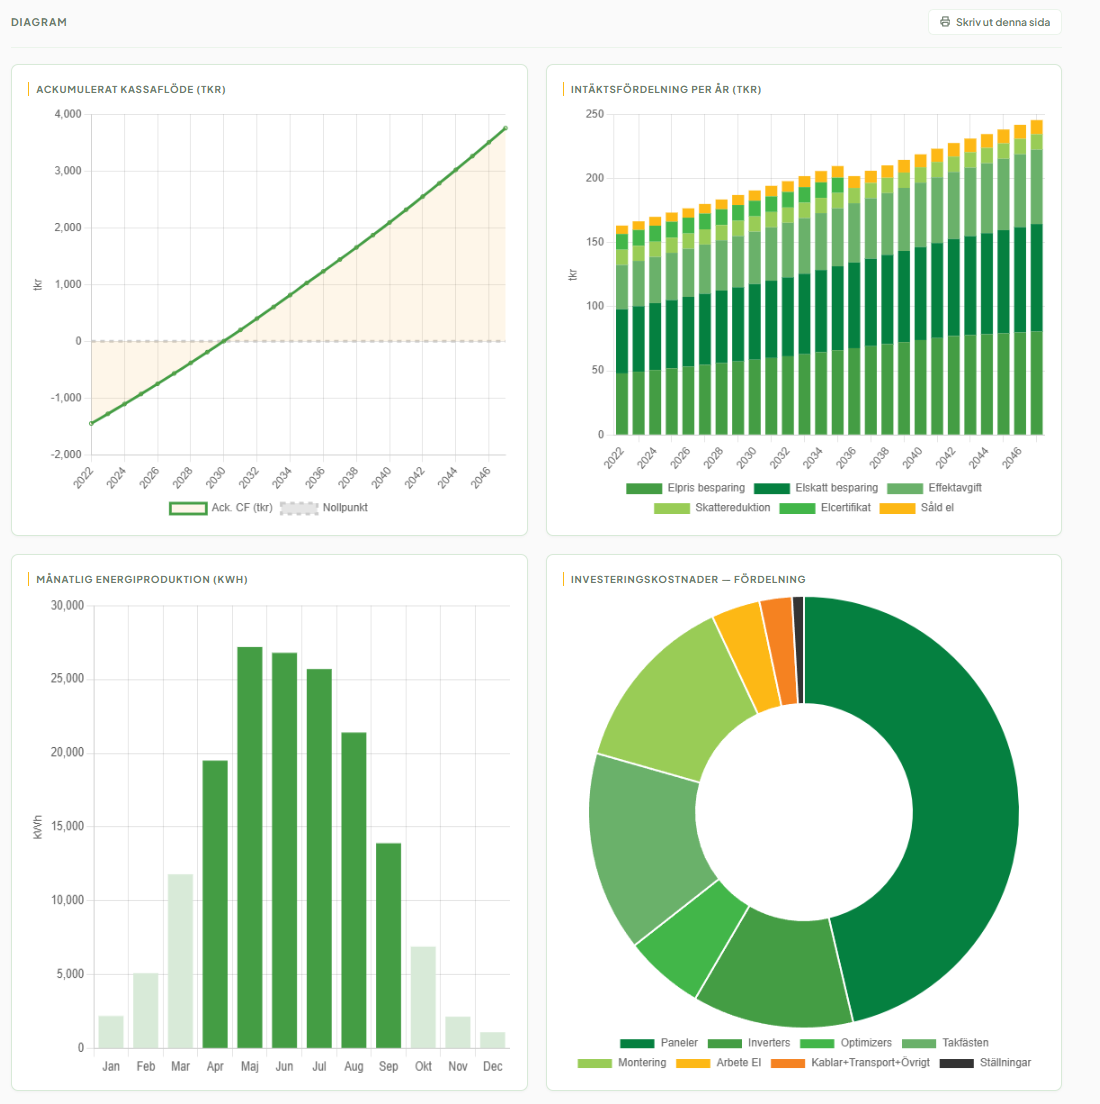
- Diagram — four Chart.js views: cumulative cash flow, annual revenue stack, monthly production, cost breakdown.
- Sammanfattning — executive summary and a six-page print layout for PDF export, with an optional AI-generated investment commentary (OpenAI
gpt-4o-mini, key entered at runtime, never persisted).
Financial model
- NPV as
PV(revenues) + PV(investment subsidy) − gross investment. - IRR via Newton-style root-finding on the cash-flow series.
- LCOE from net-of-subsidy investment over discounted lifetime production.
- Payback from the accumulated discounted cash-flow curve.
Domain modelling
- Three built-in electricity-price scenarios (EU reference, high-fossil, low) plus a user-defined growth model, each with a plateau year.
- Elcertifikat phase-out modelled per installation year, tracking the Swedish quota obligation down to zero in 2035.
- Investment subsidy with percentage and absolute cap.
- Effect tariff, electricity tax, retailer markup, tax deduction, and sold-surplus share — each time-varying with independent growth rates.
Configuration is JSON-driven: price scenarios and example projects live in sibling files (elpris_scenarier.json, exempel_a1.json, exempel_b1.json) and reload without touching code.
SolOffert — the proposal studio
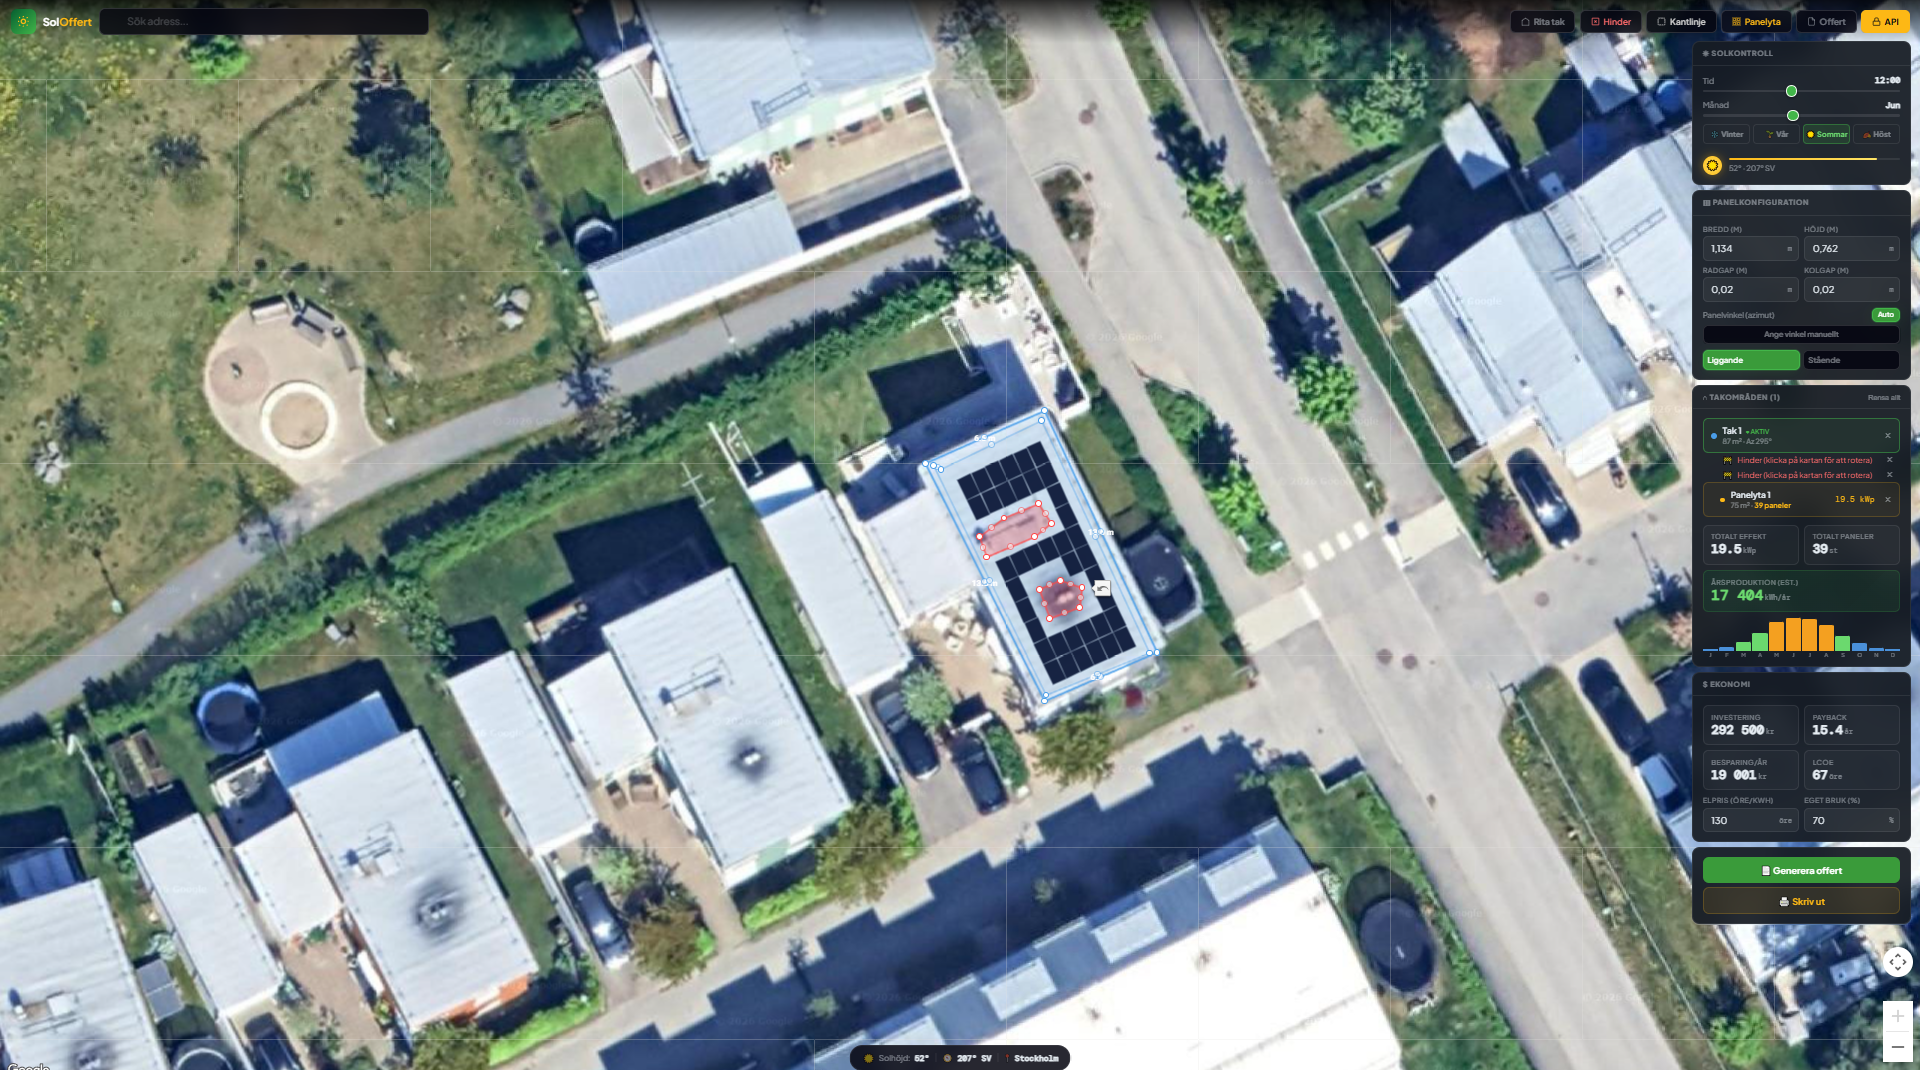
React 18 + TypeScript on Vite 5. An installer types an address, draws the roof, drops obstacles, and the app places the panels and produces the quote.
The flow
- Google Places autocomplete → zoom to address.
- Draw one or more roof polygons on satellite imagery.
- Drop obstacles and keepout lines that block placement.
- Define panel zones — the geometry engine auto-fills them with panel rectangles under real constraints.
- Overlay Google Solar API data — annual flux, monthly flux, hourly shade — rendered from GeoTIFF into the map.
- Read off system size, annual production, payback, LCOE from the economics module.
- Export a printable quote with customer info and the technical/economic numbers.
Engineering highlights
- Panel-packing geometry — auto roof-axis detection, point-in-polygon + keepout buffers, collision checks against obstacles. The fill respects the roof, the zone, and every keepout at once.
- GeoTIFF in the browser — fetch, parse (
geotiff), colour-map, and render to a canvas ground overlay bound to the Solar API's geographic bounds. - MapManager abstraction — one module owns drawing state, overlay lifecycle, undo stack, and panel recomputation. UI components stay stateless relative to the map.
- Solar position model — NOAA simplified calculation for altitude/azimuth; feeds direction labels and shade reasoning.
- Hybrid API-key strategy —
VITE_GOOGLE_MAPS_KEYat build time, or runtime entry persisted in local storage for demos.
Module layout
| Module | Role |
|---|---|
src/App.tsx | State reducer, async orchestration, UI composition |
src/lib/mapManager.ts | Google Maps integration, drawing, panel fill, undo |
src/lib/solarApi.ts | Typed clients for buildingInsights and dataLayers |
src/lib/tiffRenderer.ts | GeoTIFF fetch / cache / render pipeline |
src/lib/economics.ts | Production distribution and financial model |
src/lib/sunCalc.ts | Sun altitude/azimuth, direction labels |
Stack
SolcellsKalkyl — HTML5, CSS custom-property design system, vanilla ES2020+, Chart.js 4.4, OpenAI Chat Completions, JSON config.
SolOffert — React 18, TypeScript 5 (strict), Vite 5, Google Maps JS API, Google Places, Google Solar API, geotiff 2.1.
Takeaways
The interesting part wasn't any single component — it was the fit. SolcellsKalkyl proves out the economics on its own page; SolOffert proves out the design on the roof. Share the domain model (Swedish tariffs, elcertifikat phase-out, subsidy caps) and the two tools compose into the sales workflow an installer actually runs.
The calculator is deliberately zero-build: one HTML file opens in any browser and prints a six-page PDF. The proposal studio is the opposite extreme — a typed, geometry-heavy Vite app on top of three Google APIs. Same domain, different tool shape for different jobs.